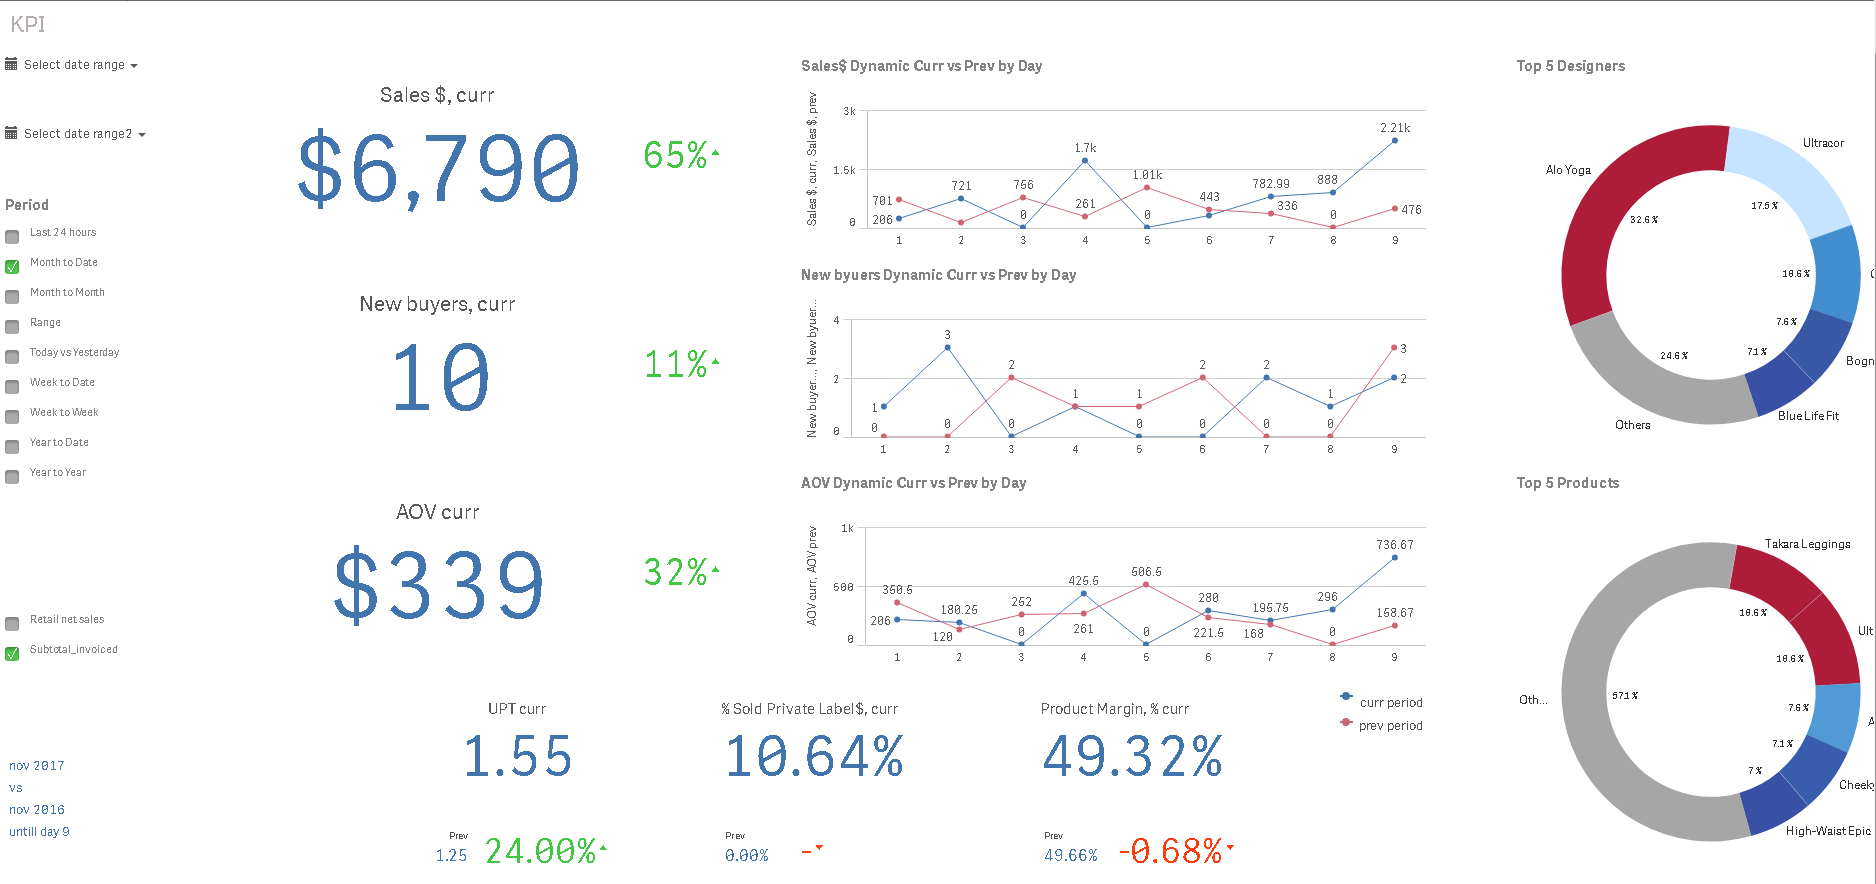
BI + Magento

Analytical tool for your e-commerce project. Ready-to-go application

KPI dashboard

It reflects the values and dynamics of the selected key indicators for the specified time intervals. Allows you to visually examine such structural components as the share of suppliers, certain types of products or services, the dynamics of new customers etc.


Overview dashboard

Allows you to review of the dynamics of sales and conversion in the context of selected time period, it also shows a sales volume for specific goods.


Sales Analysis dashboard

This sheet allows you to conduct a detailed analysis of sales by the company, showing charts and tables reflecting the TOP of the best and worst products sold in the analyzed periods, as well as a summary of sales, company profit, margin and the number of active SKUs.


BI + Magento

Take a look into a perfect solution based on BI for Magento e-shops

LFL dashboard

The sheet provides a comparative analysis of sales indicators over time periods, in accordance with which, it is possible to determine positive or negative deviations in sales dynamics and company profits.


ABC-XYZ dashboard

This sheet allows you to analyze and group the objects by the value of the coefficient of variation according to the necessary parameters specified by the user. For visual representation, a scatter plot of the distribution of the correlation coefficient relative to the selected measurement is present on the sheet.


Constructor

This sheet allows you to display all the analytical information in one table for the convenience of its analysis and comparison.


Sales Transactions

The Sales Transactions sheet is a table that displays all the necessary information for the analysis of sales transactions and comparing them at a different time periods.

Filters

This sheet allows you to select from the entire list of data only those that are currently needed. Displays already selected data in green, in white - those that can still be selected, in light gray - alternative, which means that they are excluded from the selection.

LTV cohorts

The Cohorts analysis sheet evaluates the behavior of groups of customers united by one attribute. For example, a common attribute might be the start of sales for this group of customers.