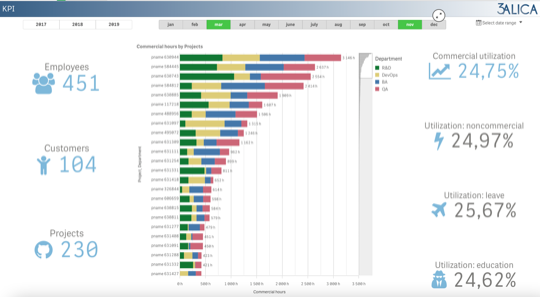
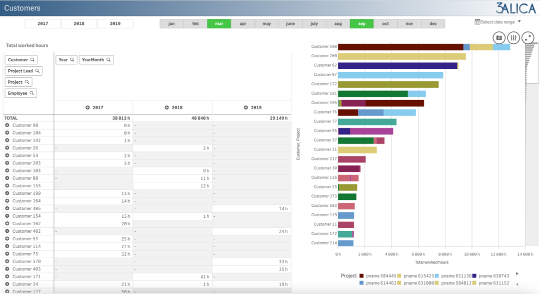
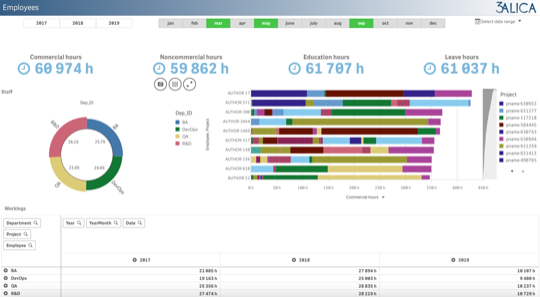
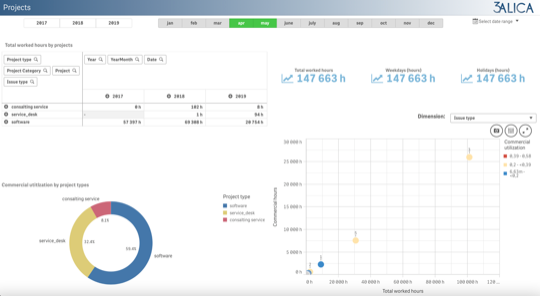
Unlock comprehensive and flexible BI tool for your project management systems

We offer JIRA+BI solution for total improvement of your PM reporting and analysis. 

  • Collect all data from different sources in a single point. 
  • Automate reporting and analytics instead of overloaded personnel and multiple excel tables. 
  • Customize solutions for the client. 
  • Transparent dashboards and quick adapt to changing accounting rules, etc. 
  • End-to-end data audit and correction. 
  • Reliable and correct financial analytics from various sources and firms. 
  •  Consolidate all the data sources with your Jira and BI

How to empower your data management with Jira + BI

We integrate leading BI platforms with your data management systems to give you a Jira+BI solution for reporting, dashboards and analytics. 

 Now you can integrate all your data sources with Jira on cloud/on premise. Use ready-made solution for a quick start and data-driven decisions. 

Ask for a full customization for your PM&BI tool consolidation

WHAT JIRA+BI APP CAN DO FOR YOU

Explore your data with greater control 

Use your own visualization solutions, such as Power BI, Qlik, Tableau or other to browse your Jira data in one place. Visualize and analyze the data, the way you need to, in order to answer the questions most important to your business.   

Extend your existing data systems  

Have an existing data lake or data warehouse? Now you can connect your data from Jira/QuickBooks and to other data sources in your organization, to create visualizations completely unique to stakeholder needs. See your data, fully in the context of your business.   

Get smarter about data visualization  

The JIRA+BI solution helps you to visualize trends and patterns in real time to make successful business decisions. Reduce to generate the reports you need to keep your organization informed and up to date at every level. 

3Alica Team

We are a global full-service BI consulting, development and outsourcing Qlik Select partner delivering BI (Qlik, Power BI and Tableau), DWH, ML and predictive analytics projects since 2010

The key metrics from your Jira
KPI
Discover all the summary info from multiple sources one the dashboard
Customers
Customers info in periods
track your personnel efficiency 
Employees
See the whole data out roles, involvement, loading.
get the helicopter view of your projects
Projects
The whole metrics from all the sources

KPI dashboard

KPI dashboard reflects the main indicators of the company in the context of employees, customers and projects; makes it possible to track the amount of time attributable to disposal in the context of commercial, non-commercial projects, as well as training. This analytics allows you to visually and in a table view display the involvement of each employee in the overall activity by the hour and display on a pie chart the share of the team member in the overall project.


Customers dashboard

Customers dashboard allows you to analyze in detail the cost data for each of the clients by every single project. The table describes time involvement of employees for each client, the chart gives a visual representation of the level of particular employee involvement at each stage of the project for a particular client in the context of any time period.


Employees dashboard

Employees dashboard allows you to analyze information about each employee in sections of departments and projects, determine the most loaded team members, and ensure a more rational distribution of personnel resources within the project.


Projects dashboard

Projects dashboard gives an info about the costs for each of the projects in a context of types of projects, categories and tasks. Visualizations allow you to get the proportion of types of projects in sections of a certain time period quickly and easy.


Plan-fact dashboard

Plan-fact dashboard reflects analytical indicators of the compliance of planned and actual costs for various dimensions: projects, employees, customers. According to the results of this analysis, it is easy to identify inconsistencies with the planned and actual values.


Selection dashboard

Selection dashboard allows you to select the measurements of interest that will be used to build analytics on other sheets of the application. This sheet allows you to select the desired sections and independently adjust the area of the analyzed values.


Business Intelligence for Jira

Discover and consolidate all your projects data for effective management and decision making