3 of 10: Why BI Automation Projects Fail and What to Do About It
Why there’s some BI automation projects successful and others are not? In our observations, out of 10 BI projects (implementation of business intelligence tools) only 3 can be considered successful.
Business intelligence is the technology-driven process of analyzing data and presenting actionable information that helps executives, managers, and other corporate end users make informed business decisions.
Let's first define the criteria for a successful business intelligence project. Based on global experience, a successful business intelligence project transforms the organization and enables the implementation of data-driven organizational performance management methods by making informed daily decisions at all management levels. At the same time, the data on the basis of which decisions are made are available, correct and correct and represent a “single point of truth”, which reflects the degree of achievement of the goals and strategic objectives facing a particular company.
So let's take a look at the factors that will get you closer to a successful BI implementation.
1. Availability of implementation strategy
Why, when we launch a new business or enter a new market, we always start with a business plan or strategy, and when implementing business intelligence tools, we believe that we will deal with the project along the way? In our opinion, the first critical mistake is the absence of a developed BI implementation strategy, when the key goals of analytics automation for each department are not defined, requirements are not systematized and unified, and project payback reserves are not identified. Although they are in any company and with any analytical application. The company can go through this stage on its own if the staff has the appropriate qualifications (this will be discussed below) or apply for such a service to integrators.
Example: a retail company has implemented a tool such as the calculation of a recommended order (an automated system for generating orders for the supply of goods in a store, with a built-in auto-order system. It allows you to reduce inventory and eliminate lost sales. This has a positive effect on the turnover period of inventory).
As a result, the turnover period of goods was reduced by 27%. And the project on automation and implementation of the system paid off in a few months, as huge resources were freed up, invested in "excess" inventory.
When making calculations, the company took into account the payback period of the automation project. When the planned savings on turnover were achieved, the project paid off in a few months.

2. Availability of process or data management function
Once you are ready to launch a business intelligence project, you should pay attention to data management. But don't postpone the project until your data is perfect. We will disappoint you: such a moment will never come. Until the data becomes user data, and not data from the IT department or the accounting department, there will be no order in it. But when users are unable to delve deeper into analytics due to bad data, they will be well motivated to manage the data. Common mistakes in data management are:
• Separate data warehouses for different departments, for example, accounting documents separate from the accounting of daily operations for core activities
• Double entry of information - different departments enter the same information twice
• Data outdated - late closing, data entry late, etc.
• Data streams in reality and in the system are not synchronized
• Data is gradually enriched with analytics from different users
• There is no single center of information management - master data is subject to change without notice
• There are no regulations and provisions for data management.
Since 2002, a new position has appeared in the United States and Europe - Chief Data Officer (Chief Data Officer). This is the same top manager as the CIO, commercial director or CFO. Its functionality includes the development of a strategy for working with data, setting up data management processes. Unfortunately, a few Belarusian companies really pay due attention to this resource. A CDO must be able to see the potential in the data available, understand how it relates to each other, and combine all disparate data sources from different departments in an optimal way. The role of CDO is to improve the efficiency of methods of working with information. In our country, it is almost never found in companies.
The first CDO in January 2002 was appointed by Catherine Clay Doss at Capital One. IBM defines CDO as "the leader who develops and implements data and analytics strategies to drive business opportunity."
3. Business analysis is not equal to reports: understanding the essence of analytics
The approach when users proceed from the paradigm "transfer our report to BI systems" will not help to achieve the desired return on investment.
Business intelligence tools allow you to set up unified analytical chains, make it possible to quickly understand relationships, cause-effect relationships, and simulate different consequences of decisions. This is not equal to the report.
Compare the two approaches to analysis :
1. Sales report for January and February 2019 with details - by customer groups and types of goods.
2. Which of my A-class buyers stopped buying in February the goods that everyone else is buying?
Until you manage to overcome this stereotype among the future users of the IT system - your employees - the project will not deliver the tangible improvements in analytics that it could bring.

4. Development of an analytical culture
The initial goal of the BI project is the transformation of culture, a single information space:
• Sharing data by several departments, interaction regulations in data preparation processes
• A unified analytical system for reporting and forecasting used by managers and employees
• Reporting and analytics are not created in separate transactional systems, local data sources are not used
• Unified data glossary for departments
• A well-built analytical cycle, each employee knows and understands what information he should analyze daily, what - weekly and what - monthly
• The presence of collegial analytical bodies: a sales review committee, an analytical group to discuss production cycles, etc.
• Centralized analytical services and data quality control service
• Using system data for operational reporting
• Transparent model and data flow diagram, centralized control of master data and key metadata changes.
Another top manager position, which has already become part of corporate governance in Europe and the United States, is the Chief Analytics Officer. The functionality of CDO and CAO is largely overlapping. But if the former focuses more on the backend (i.e. data management), then the latter focuses on the strategic use of data, that is, as the title of this position suggests, on their analysis. If analysts can be subordinate to the CDO, then the CAO must have them.
The role of the CAO is to improve the efficiency of the data-driven working methods and corporate culture and bring tangible value to the company. The CAO must be able to discern the potential in the available data, it must oversee the activities of the company's analytical structure, provide training and professional development, and reorganize if necessary.
Data is strategic only if it has been analyzed and taken into action across the company, so that the value of that data is fully realized.
Now in the world there are about 7 models for building the analytical function in an organization.
5. Unification of methodologies for calculating indicators
Very often there is a situation when, even in a BI project, each department asks to implement different methods for calculating the same indicators. We believe that financial competencies are needed here in order to choose the most unbiased approach to calculating indicators, for example, in accordance with IFRS. It is in European projects that we recommend highlighting the role of the project methodologist, most often it is a financial director or a third-party financial consultant who looks holistically at the methods for calculating all indicators. Here are the main problems associated with the lack of unification of calculation:
• There are no uniform rules / methodology for collecting reports
• Reporting is fragmented, there is no “single point of truth” for all users and data
• Reporting depends on advanced users
• Each department generates its own "reports"
• The connection between the user and the original data is lost
• The modeling/forecasting cycle gets complicated
• Financial reports are collected "manually" or "rolled up downloads" from accounting system.
• No time for financial analytics
• The data is available only after closing the accounting department.

6. Choosing the right architecture for the BI project
Based on the global experience of large projects, we recommend this architecture from the point of view of users (we will leave the technical architecture for separate discussion):
• Detailed analytics applications that analysts can run
• Role panels - for individual employees with a limited set of operational information
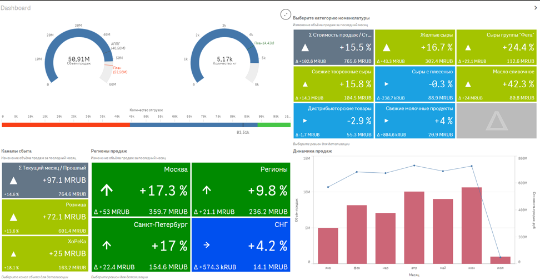
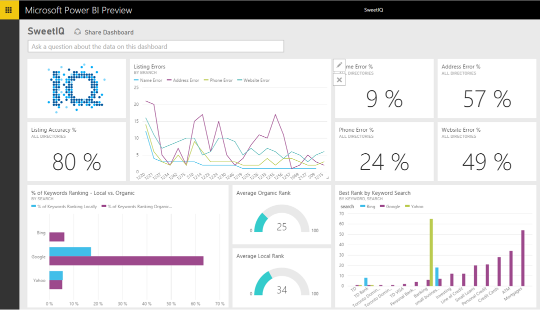
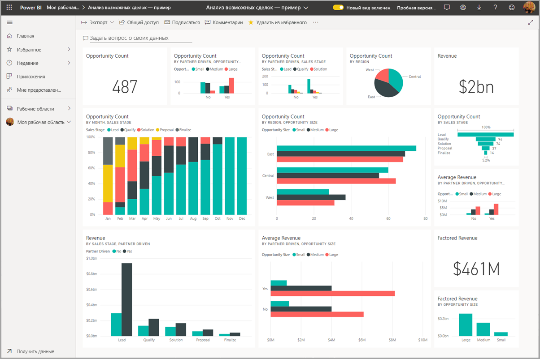
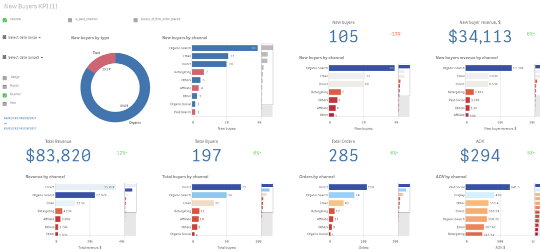
• Dashboards (dashboards) for managers that allow you to control key processes.
KPI dashboards or key indicators for management are very popular in the market now. They show all the main indicators of the company in real time, usually available from a mobile phone or tablet anywhere in the world. This allows you to monitor the situation and make management decisions based on a reliable picture of data on sales, stocks, debts, assortment, and much more. It is very important to understand that simply implementing dashboards will not change the processes in the company. Dashboards can be part of a business intelligence implementation project or the stage that, due to its simplicity and convenience, will involve users. This is a great tool, but it will only work effectively if a number of conditions are met:
1. Development of decomposed KPIs specifically for your company, which reflect the strategy, goals and objectives of a particular company at a specific point in time.
2. Decomposition of general KPIs - to individual ones, which show what each specific employee / top manager must do to achieve the current goals of the company.
3. Development of convenient visualizations to reflect the personal area of responsibility of each employee with all the necessary and really measurable metrics.
4. Attracting three types of competencies: IT, finance and management.
Only the combination of the three areas will provide a working tool that will develop business intelligence in the company.
№1
OFFICIAL BI PARTNER STATUS
10+
Years in Business
100+
Full-time developers
450+
Projects Completed
Contact us
Feel free to reach out — our team is here to help you!
Categories
Links
2009-2024 | 3Alica | All rights reserved